Customizable drill-down options are available in dashboard widgets. It is possible to dive deeper by clicking the presented search results. The options to dive into specific parts of the result depends on the type of the search query. For example, while viewing a search result that includes fields such as destination_address, destination_port, source_address, and source_port in the query, it is possible to drill down the results based on these parameters.
The process of drill-down from a dashboard widget is the same as that of the search query. Two typical scenarios that cover all the aspects of search visualization from dashboard widget are described in this section.
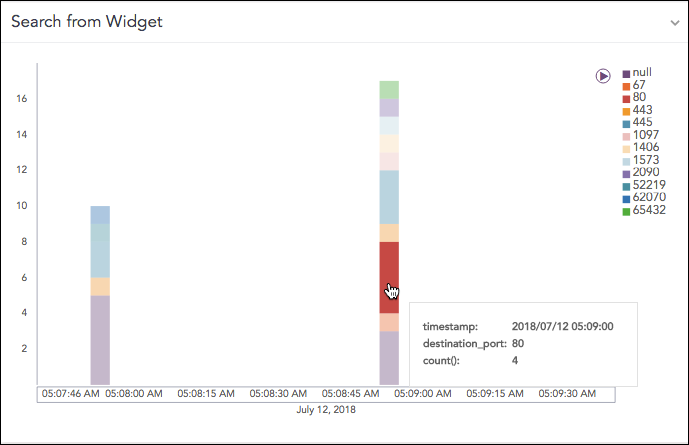
Consider a widget with the following search query.
destination_address=* | timechart count() by destination_port
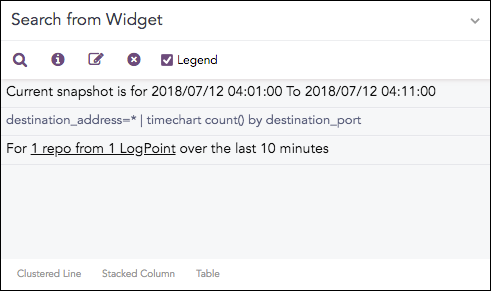
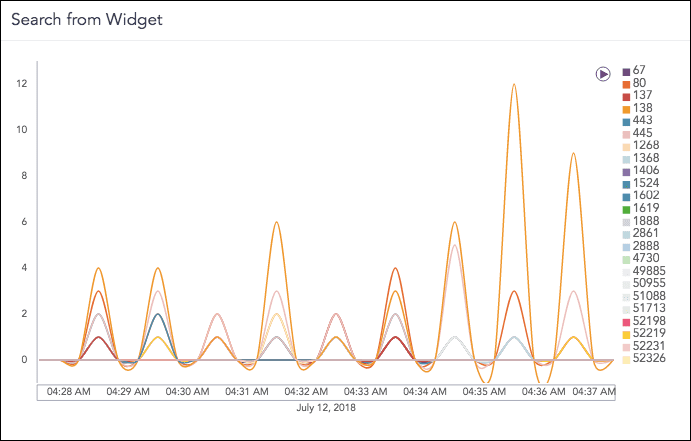
The query displays the following visualization in the widget.
You can toggle between the edit and non-edit mode using the widget options. From the edit mode, you can choose for the available representations of the search results (in this case Clustered Line Chart, Stacked Column Chart, and Tables). In the non-edit mode, you can carry out the drill-down process.
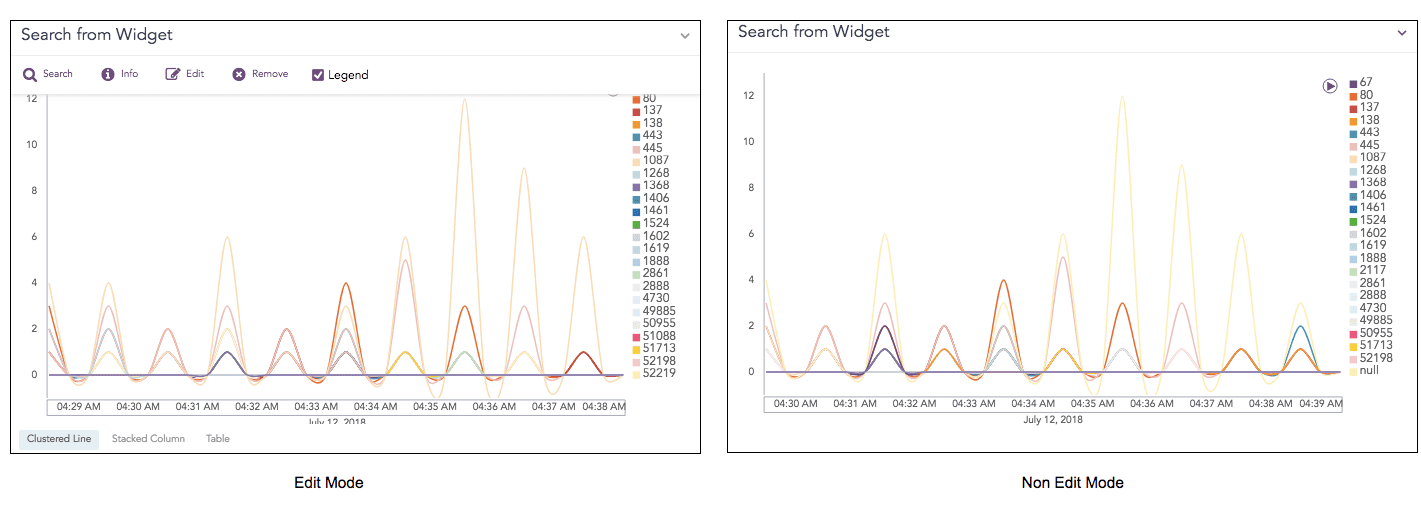
Edit and Non Edit Mode
Select the section of destination_port: 80 and count(): 3 for the drill-down purpose.
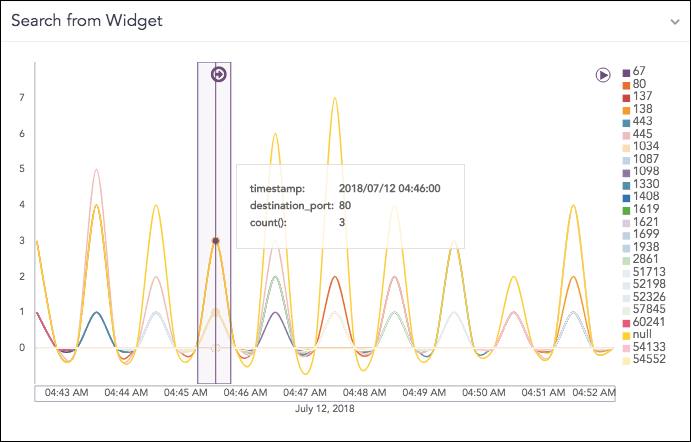
Drilldown
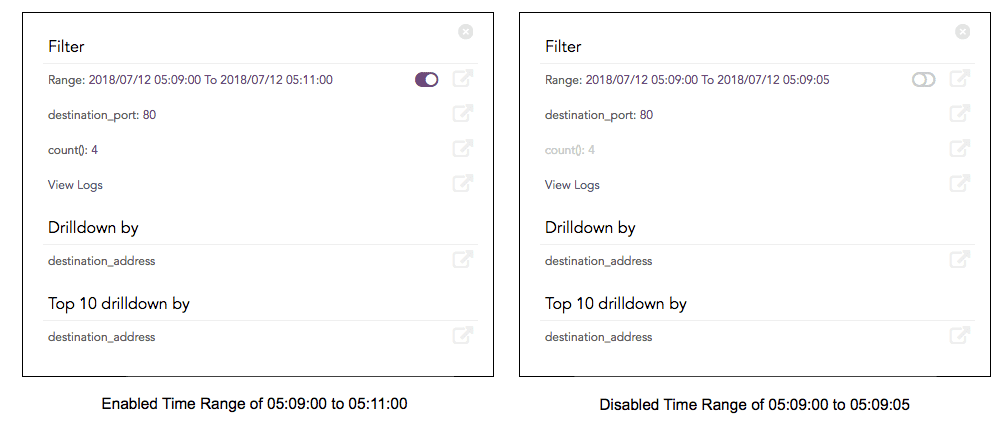
When you click on the highlighted section of the result, a context menu appears with the options to further drill down on the specific parameters which are:
Filter
Drill down by
Top 10 drill-down by
The Filter type drill-down searches on Range, destination_port and count(). The Drilldown by and Top 10 drill-down by types drill-down searches on the destination_address.
The results of all three types of drill down can be opened and viewed in the same window or a new window. The drill down on Range value (either on full or partial time-range) can be enabled or disabled by clicking the toggle icon.
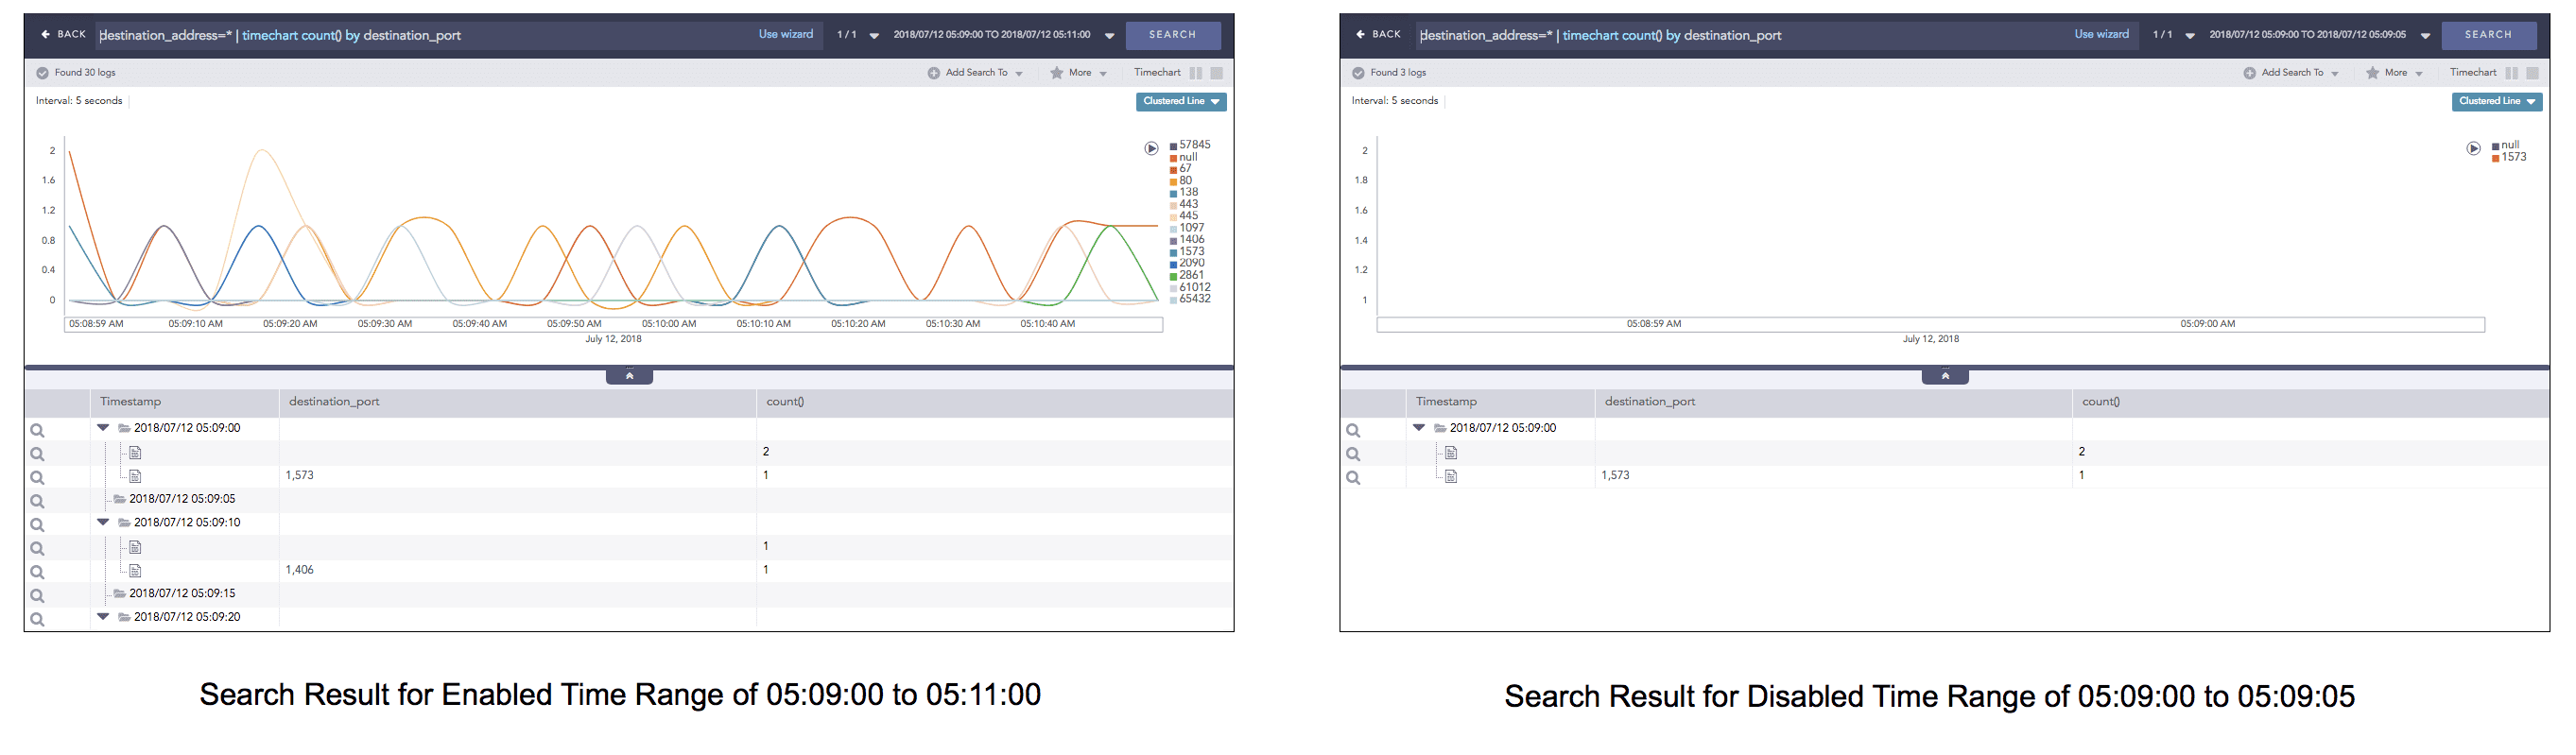
While performing the drill-down on the Range value, the search results for the time-range opens on the same page. The search results for the enabled and disabled time-range are shown below:
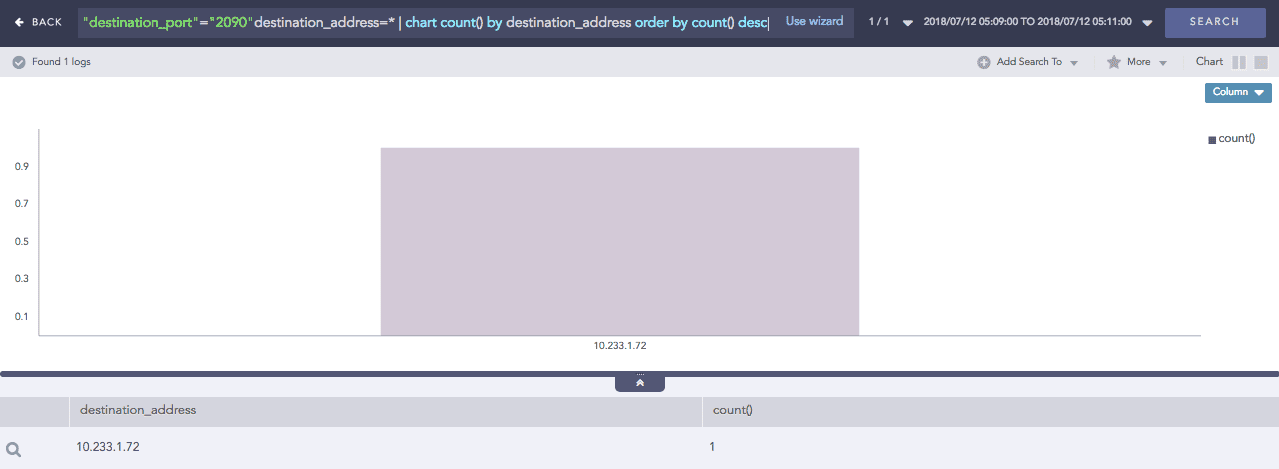
Likewise, when the drill-down is carried out on the “destination_port”=138, the search result for the destination port opens in the same page.
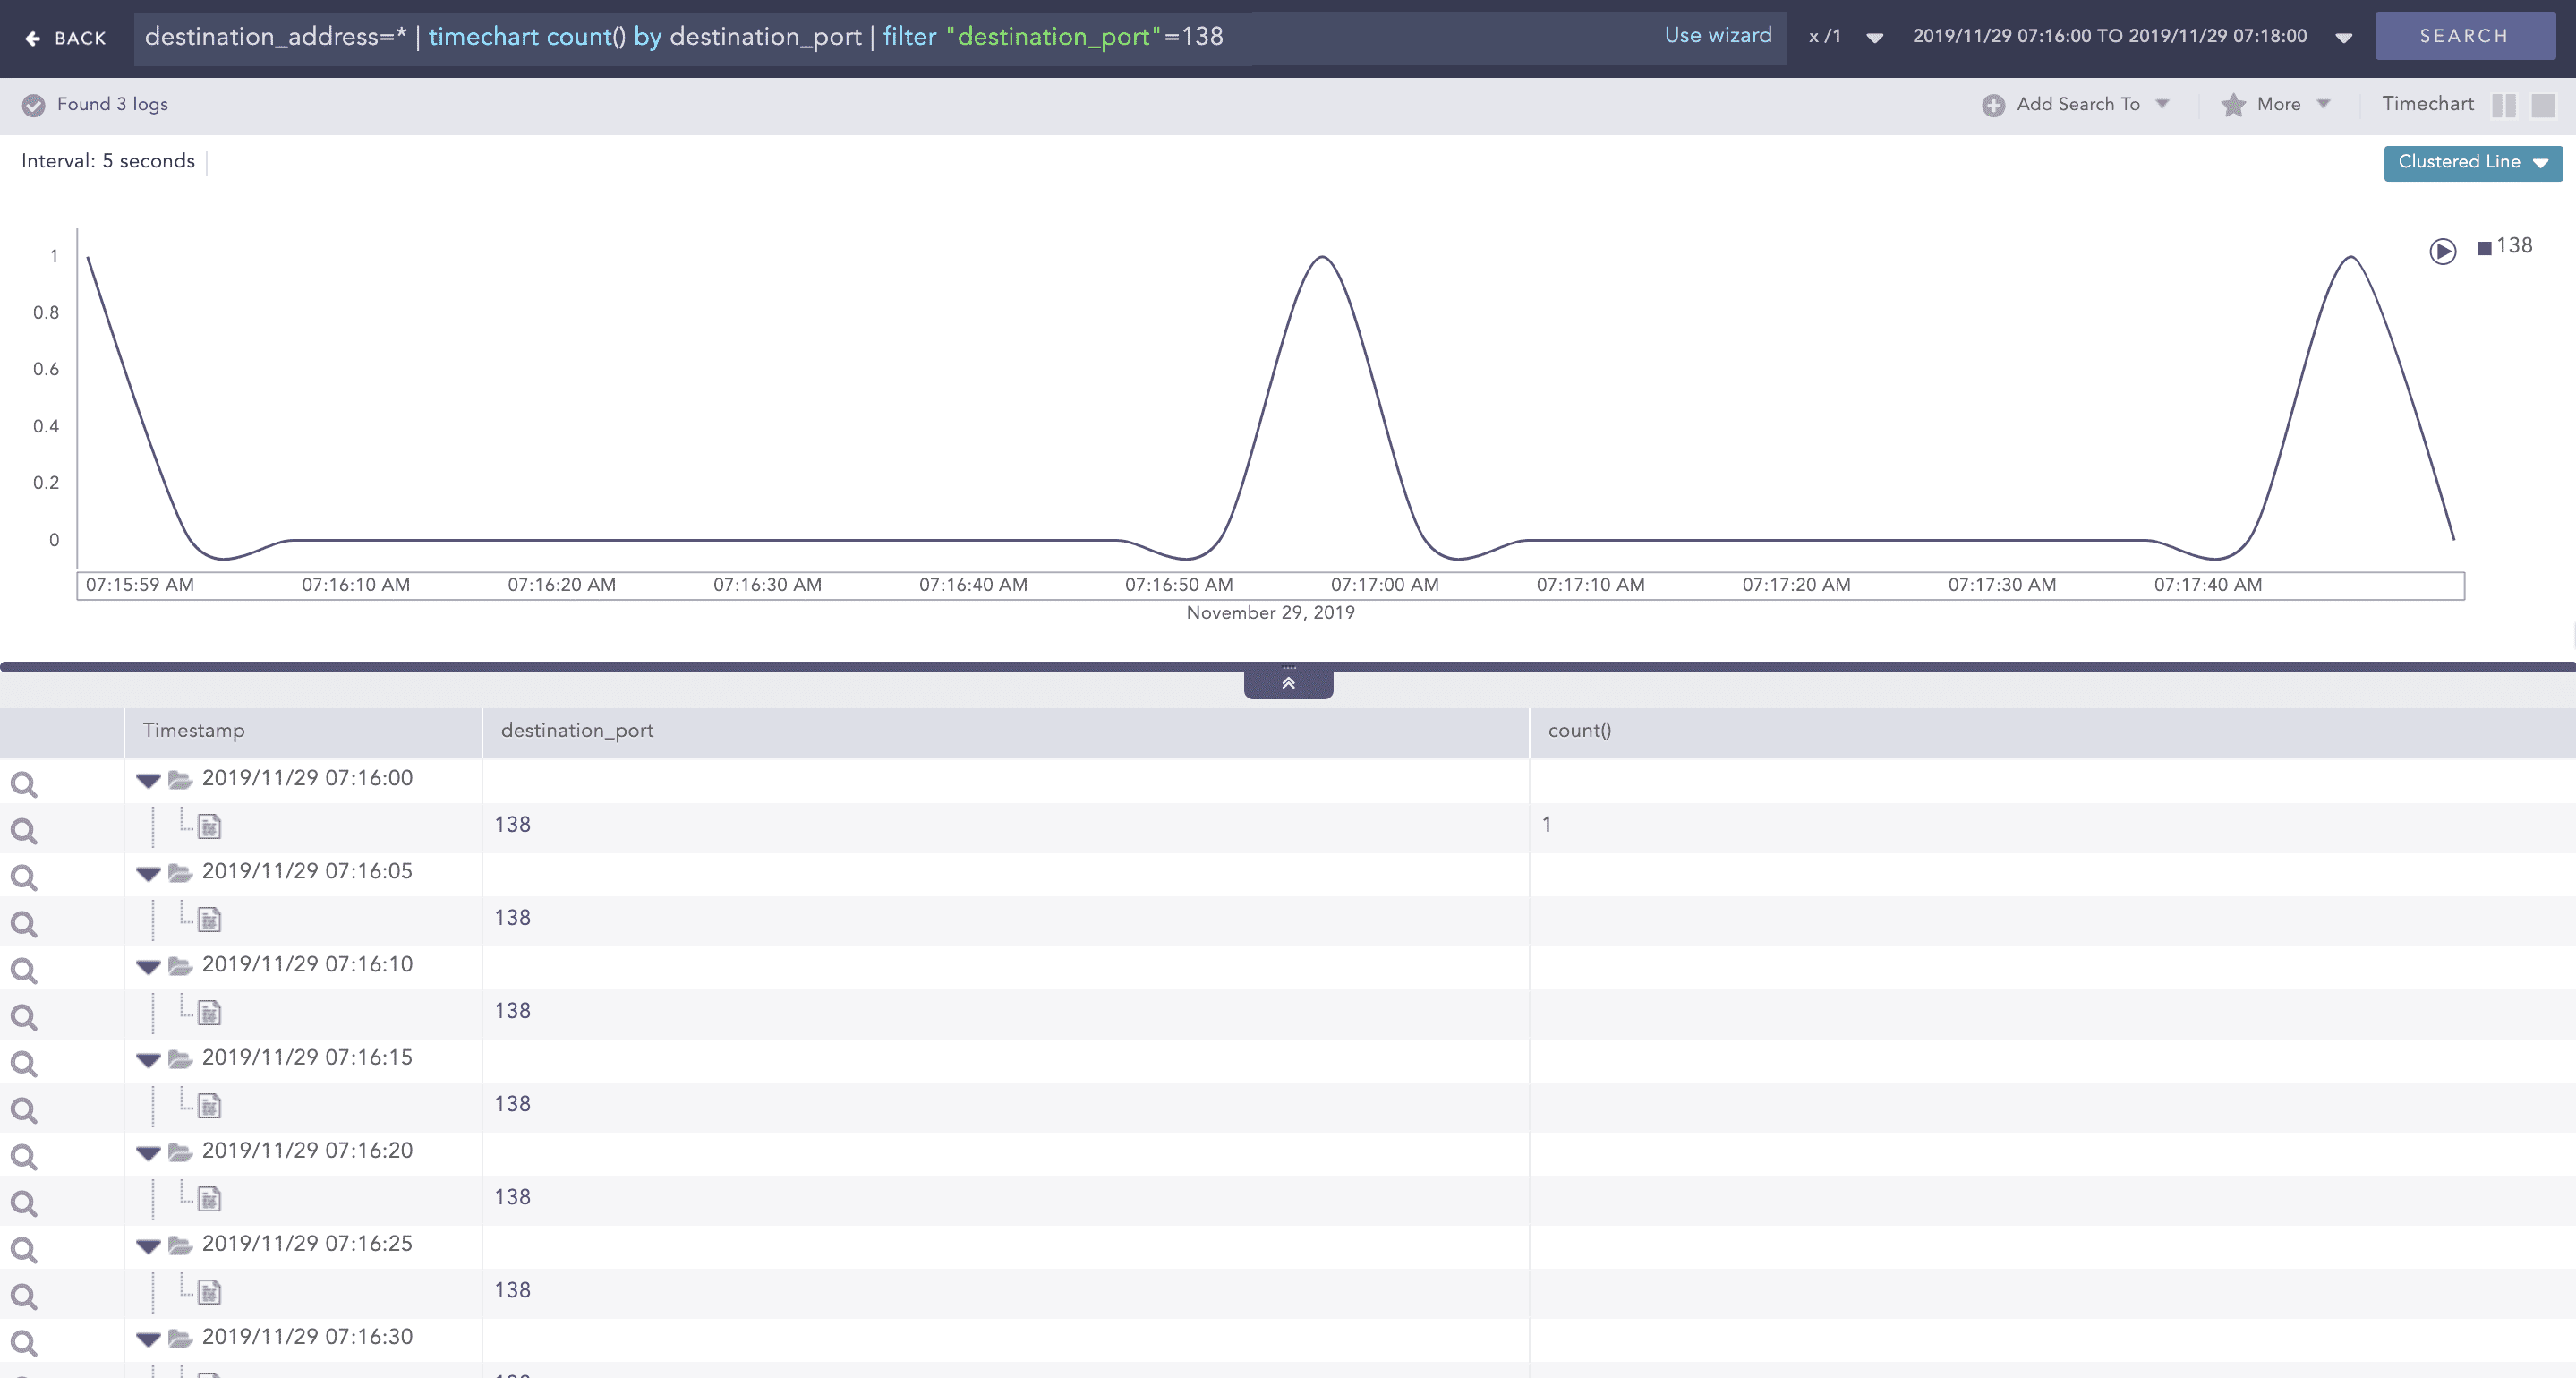
Drill down on destination_port
When the drill-down is carried out on “count()”=3, the search results for the count of logs opens on the same page.
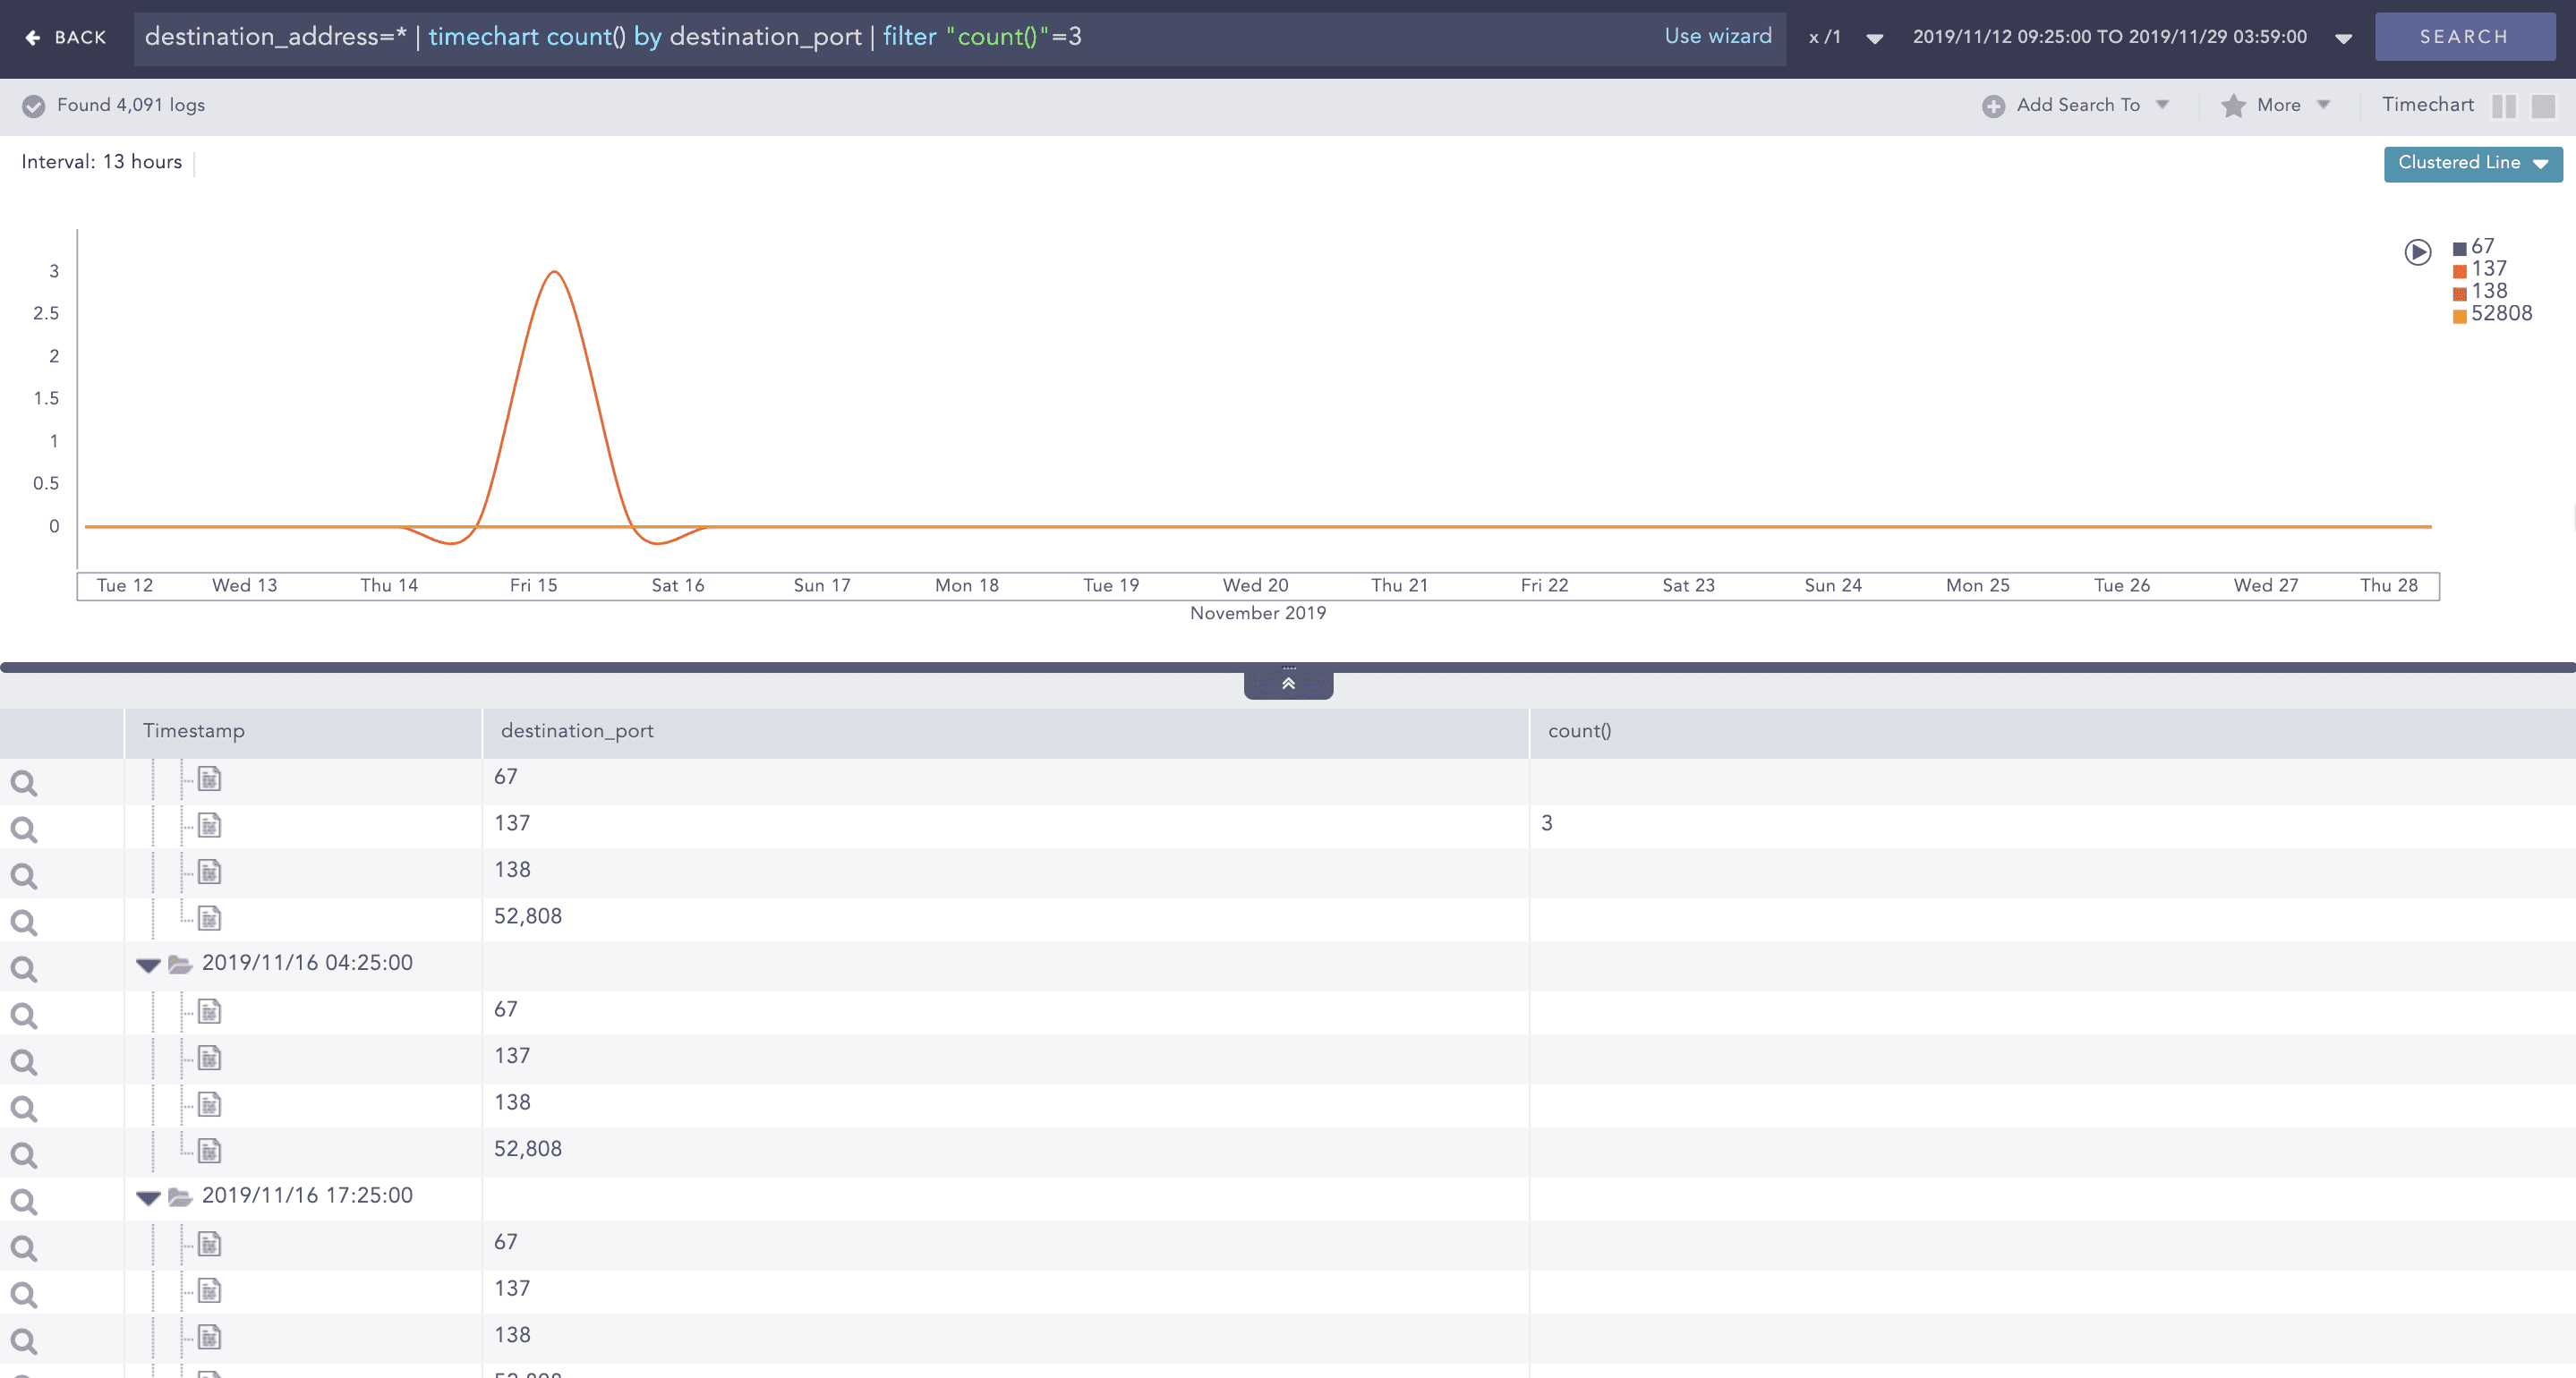
Drill down on count()
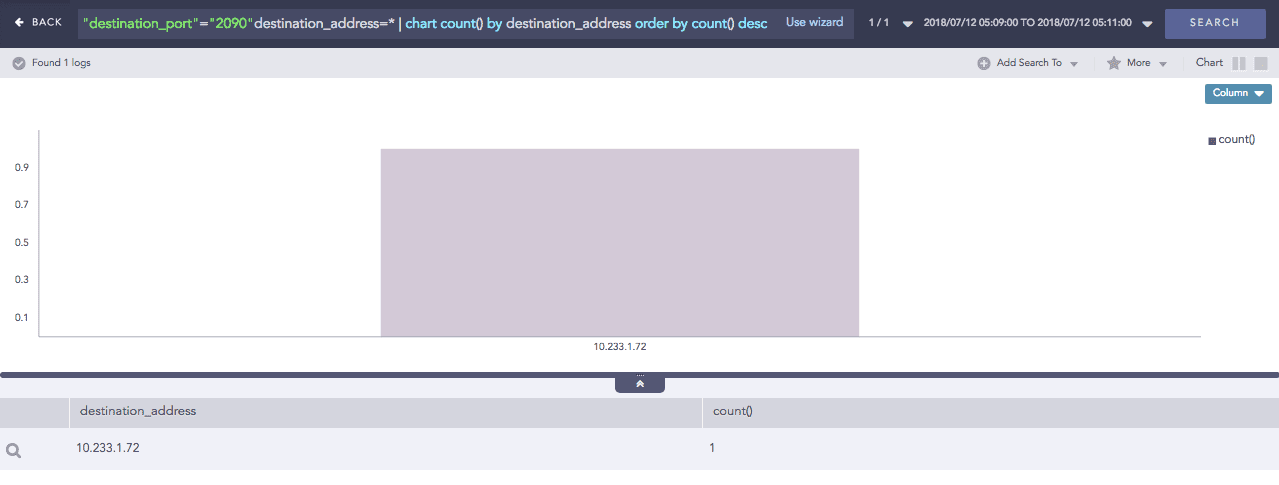
When the drill-down is carried out on the destination_address, the search result for the destination address opens in the same page.
Drill down on destination_address
When the Top 10 drill-down is carried out on the destination_address, the search result for the destination address opens in the same page.
Top 10 Drilldown by destination_address
Consider a widget that has no search query.
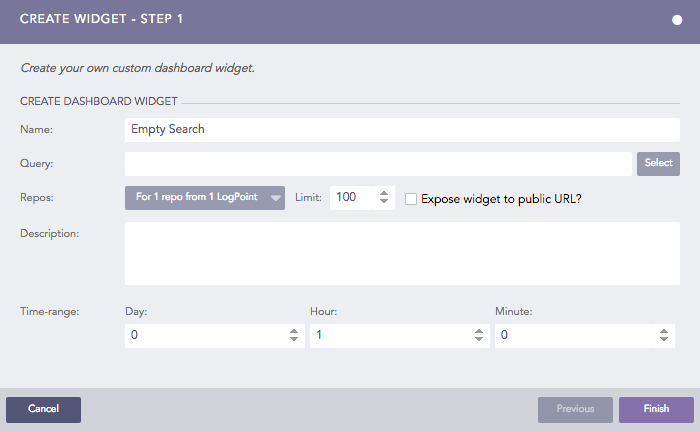
The blank query displays the following visualization in the widget.
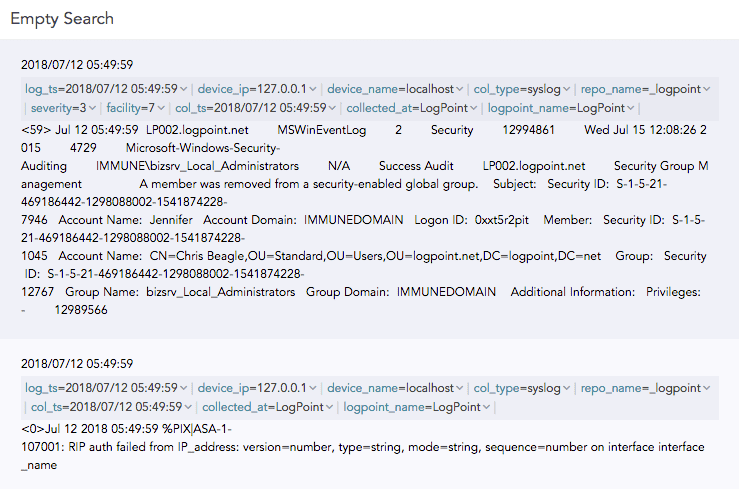
The search result for a blank query is the logs collected for the specified range of time without any visualization. However, you can refine the search query by clicking the components of the search results such as a key-value pair, or a raw log message. Clicking on any value in the result opens a regular search with the selected parameter as the search query.
For example, if you click syslog on the search results:
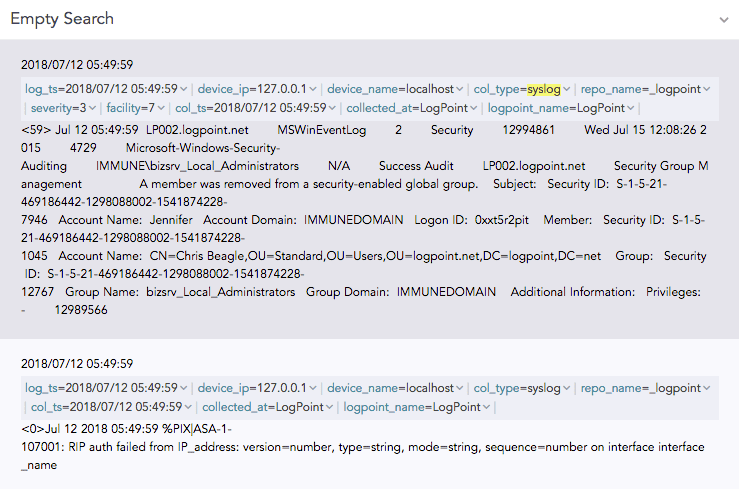
This opens the search result of the query “col_type”=”syslog.” The search visualization depends on the chosen value.
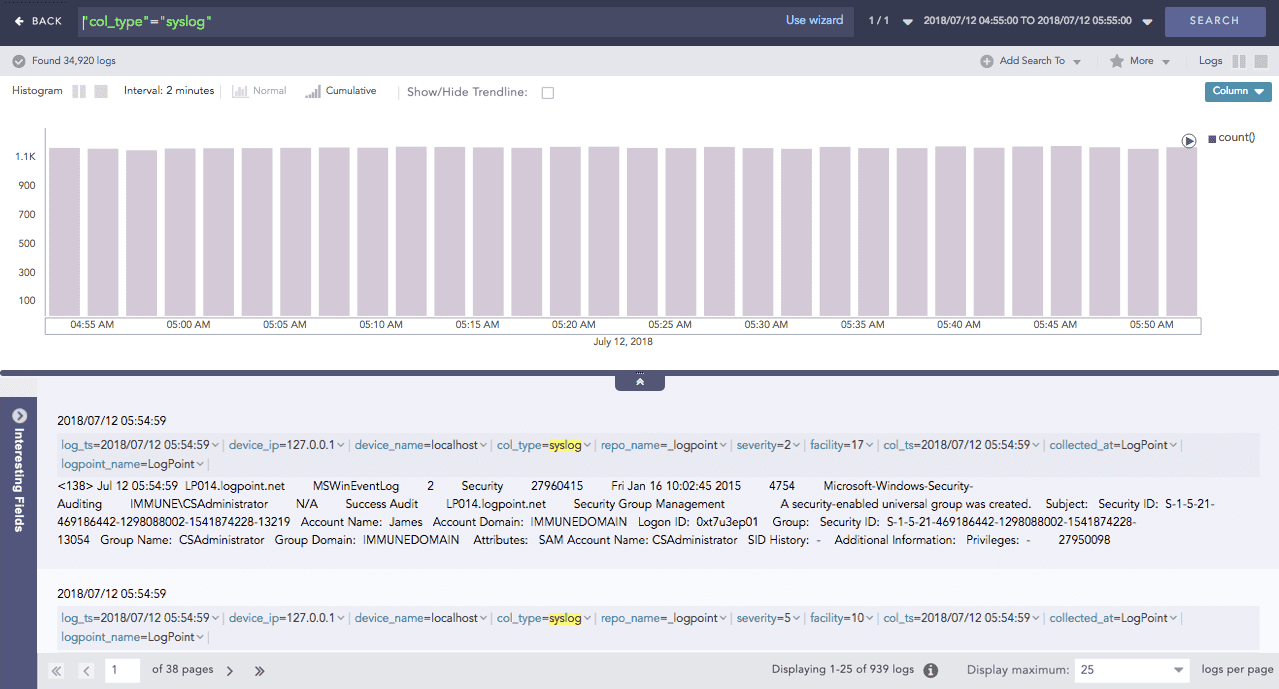
From this point, a regular drill-down can be carried out. If you hover over any section of the search results, the related information of the section is summarized in a tooltip.
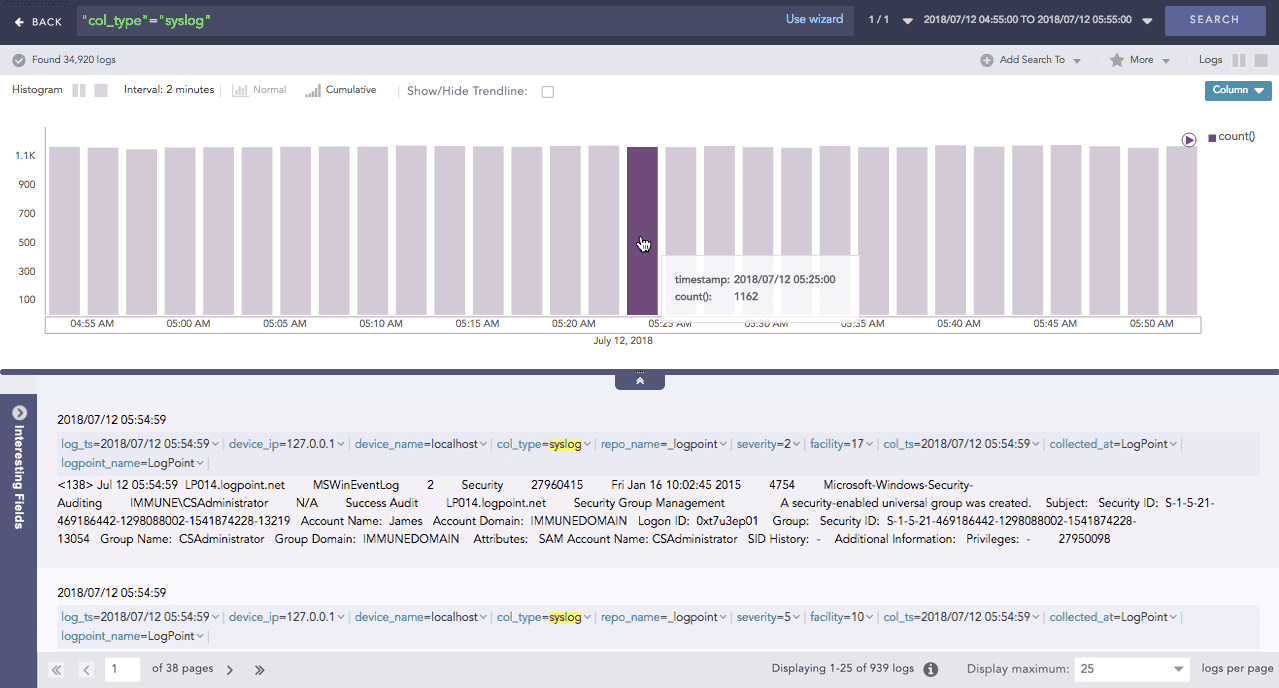
Clicking on the highlighted section opens a new dialog box with the same three drill-down options of Filter, Drilldown by, and Top 10 drill down by which can be carried out in the same way as described in the scenario-1.
